
Pushover Analysis Summary Table
After performing the analysis, the main calculation and verification information relating to the pushover seismic analysis is reported in the same sheet that allowed the analysis to be started.
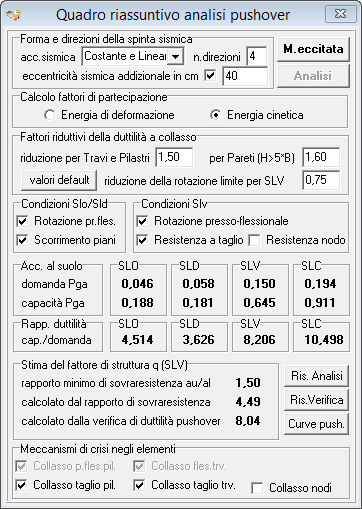
Calculating participation factors
The user has the option to select the norm by which to evaluate the mass participation factors in the pushover analysis.
There are two options available:
- Kinetic energy
- Strain energy
The kinetic energy norm is the most traditionally used and corresponds to measuring the error in a metric that has the dimension of a mass, hence the term "excited mass percentage." This choice was viewed favorably at a time when the analysis was still conducted without the aid of automatic calculation. However, it is now recognized that it does not represent an appropriate measure for characterizing the accuracy of the truncated modal expansion. In fact, precisely because it is based on kinetic energy and therefore essentially on the square of the velocity, it tends to overestimate the weight of the high-frequency modes, characterized by high velocity and low excursion. Therefore, as the number m of modes considered varies, the excited mass percentage me tends very slowly towards unity, so much so that it is generally believed that the condition me ≥ 90% already characterizes sufficient accuracy.,
Although a 10% error, if actual, can be difficult to accept. The residual error is sometimes excessively overestimated, making compliance with the verification truly difficult. In some cases, where parts of the structure are characterized by displacements so small that they can be considered almost prevented, the difficulty can only be circumvented by eliminating these parts from the mass count. In some software programs, this is done by forcing the floors considered "non-seismic" to eliminate them from both the dynamic modeling and the mass counting. The strain energy norm, since it is directly expressed in terms of the square of stresses, obviously provides a much more appropriate measure for reconstructing both the stresses and displacements produced in the structure and allows for a more reliable characterization of the error produced by modal truncation, and would therefore certainly be preferable. In fact, the use of the kinetic energy norm is justified only by its alignment with tradition.
For further information, please refer to the chapter Participation Factors
Ground acceleration
The ground acceleration (Peek Ground Acceleration PGA) referred to ground on rock (category A) is reported in the required value and in the capacity value, for the four verification limit states (SLO, SLD, SLV, SLC).
The required value is the ground acceleration value assigned in the seismic parameters sheet for the limit state. The capacity value, on the other hand, is obtained from the pushover check and represents the minimum value among all the analyses performed, as the seismic direction and the distribution of accelerations along the height vary. The check consists of verifying that the allowable pga (capacity) is greater than the required pga (demand).
If the check is not satisfied, the capacity value is shown in red.
Limit ductility
The ratio between the allowable displacement (capacity) and the required displacement (demand) is reported for the four verification limit states (SLO, SLD, SLV, SLC).
The verification consists in checking that the limit ductility is not less than one, i.e. that the displacement capacity is greater than the displacement requirement.
If the check is not satisfied, the value is shown in red.
Estimation of the structure factor
As we said previously, one of the purposes of pushover analysis is to provide a better estimate of the structure factor, which is involved in the evaluation of spectral accelerations in elastic modal analysis.
Structure factor calculated as a function of the overstrength ratio
In particular, the pushover analysis provides the overstrength ratio αu/α1 as the seismic direction and the distribution of accelerations along the height vary. According to the Ntc08, the structure factor q can be obtained as a function of the overstrength ratio with the relationship:
q = Kr Kw Kaαu/α1
in which:
Kr ≤ Kr≤ 1.0,
Kwis the factor of presence of walls0.5 ≤ Kw≤ 1.0,
Kais the overstrength factor 1.5 ≤ Ka≤ 4.5,
depending on the structural typology and ductility class,
αu/α1is the overstrength ratio.
It should be noted that this estimate, which is often conservative but can also be dangerously overestimated, is based on heuristic evaluations and qualitative data derived from the structural typology. These factors only account for one aspect of the elastic-plastic behavior—the overstrength between the collapse load and the load at the elastic limit—but do not comprehensively account for the structure's ductility capacity. Therefore, the value obtained from the estimate, while very useful for comparing different design solutions, must be used with great caution. For safety reasons, at least in the current testing phase of the code, and as suggested in the Ministerial Decree itself, it is recommended to assume q values corresponding to an overstrength ratio no greater than 1.6.
Structure factor calculated from the pushover ductility check
Edisis provides an alternative, more reliable, method for calculating the behavior factor, which is based directly on the ductility check performed by the pushover test. The estimate is obtained by extrapolating the results of the pushover analysis to the Life Safety limit state (Severe Damage) and taking into account the relationship between the increase in the q factor and the resulting reduction in the structure's resistance. The value provided therefore represents an extrapolated estimate of the q factor, which would correspond to the equality between the required displacement (displacement demand) and the allowable displacement (displacement capacity).
This estimate has the advantage of fully exploiting the results of the analysis while remaining independent of the qualitative-empirical factors that appear in the expression in the previous paragraph. Even in this case, however, the resulting estimate, precisely because it is based on extrapolation, must be used with caution. For the sake of safety, q values that are too high or significantly different from the previous estimate should be avoided.
Crisis mechanisms in the elements
In this box we find the selection boxes:
- GDP cut collapse
- Trv shear collapse
- Node collapse.
Selecting these options determines whether the relevant brittle failure mechanisms should be checked during the pushover analysis. Clearly, the most conservative setting is selecting all three options, which is the default state. When a brittle failure corresponding to an enabled option occurs during the pushover analysis, an irreversible damage process is immediately triggered, rapidly leading to the element's collapse, severely impacting the pushover check.
For the designer, however, these options can represent a useful evaluation tool as they provide the possibility of selectively activating or deactivating a certain response and therefore determining its influence on the overall seismic capacity. This can be achieved primarily by comparing the final safety factors obtained from the analysis, but also by checking the response at the individual element level using 3D maps of the ductility load corresponding to the limit states reached. In the table, the same information is instead reported in numerical terms in the table Elements with greatest load in pushover analysis, which for each scan shows the ranking of the elements with the greatest ductility load, when the limit states Slo, Sld, Slv and Slc are reached.
Buttons for accessing the results in extended form
You can access the other results of the pushover analysis by clicking on the following buttons:
- Analysis results
- Verification results
- Pushover curves view